CH. 4 Professional Engineering Service
66
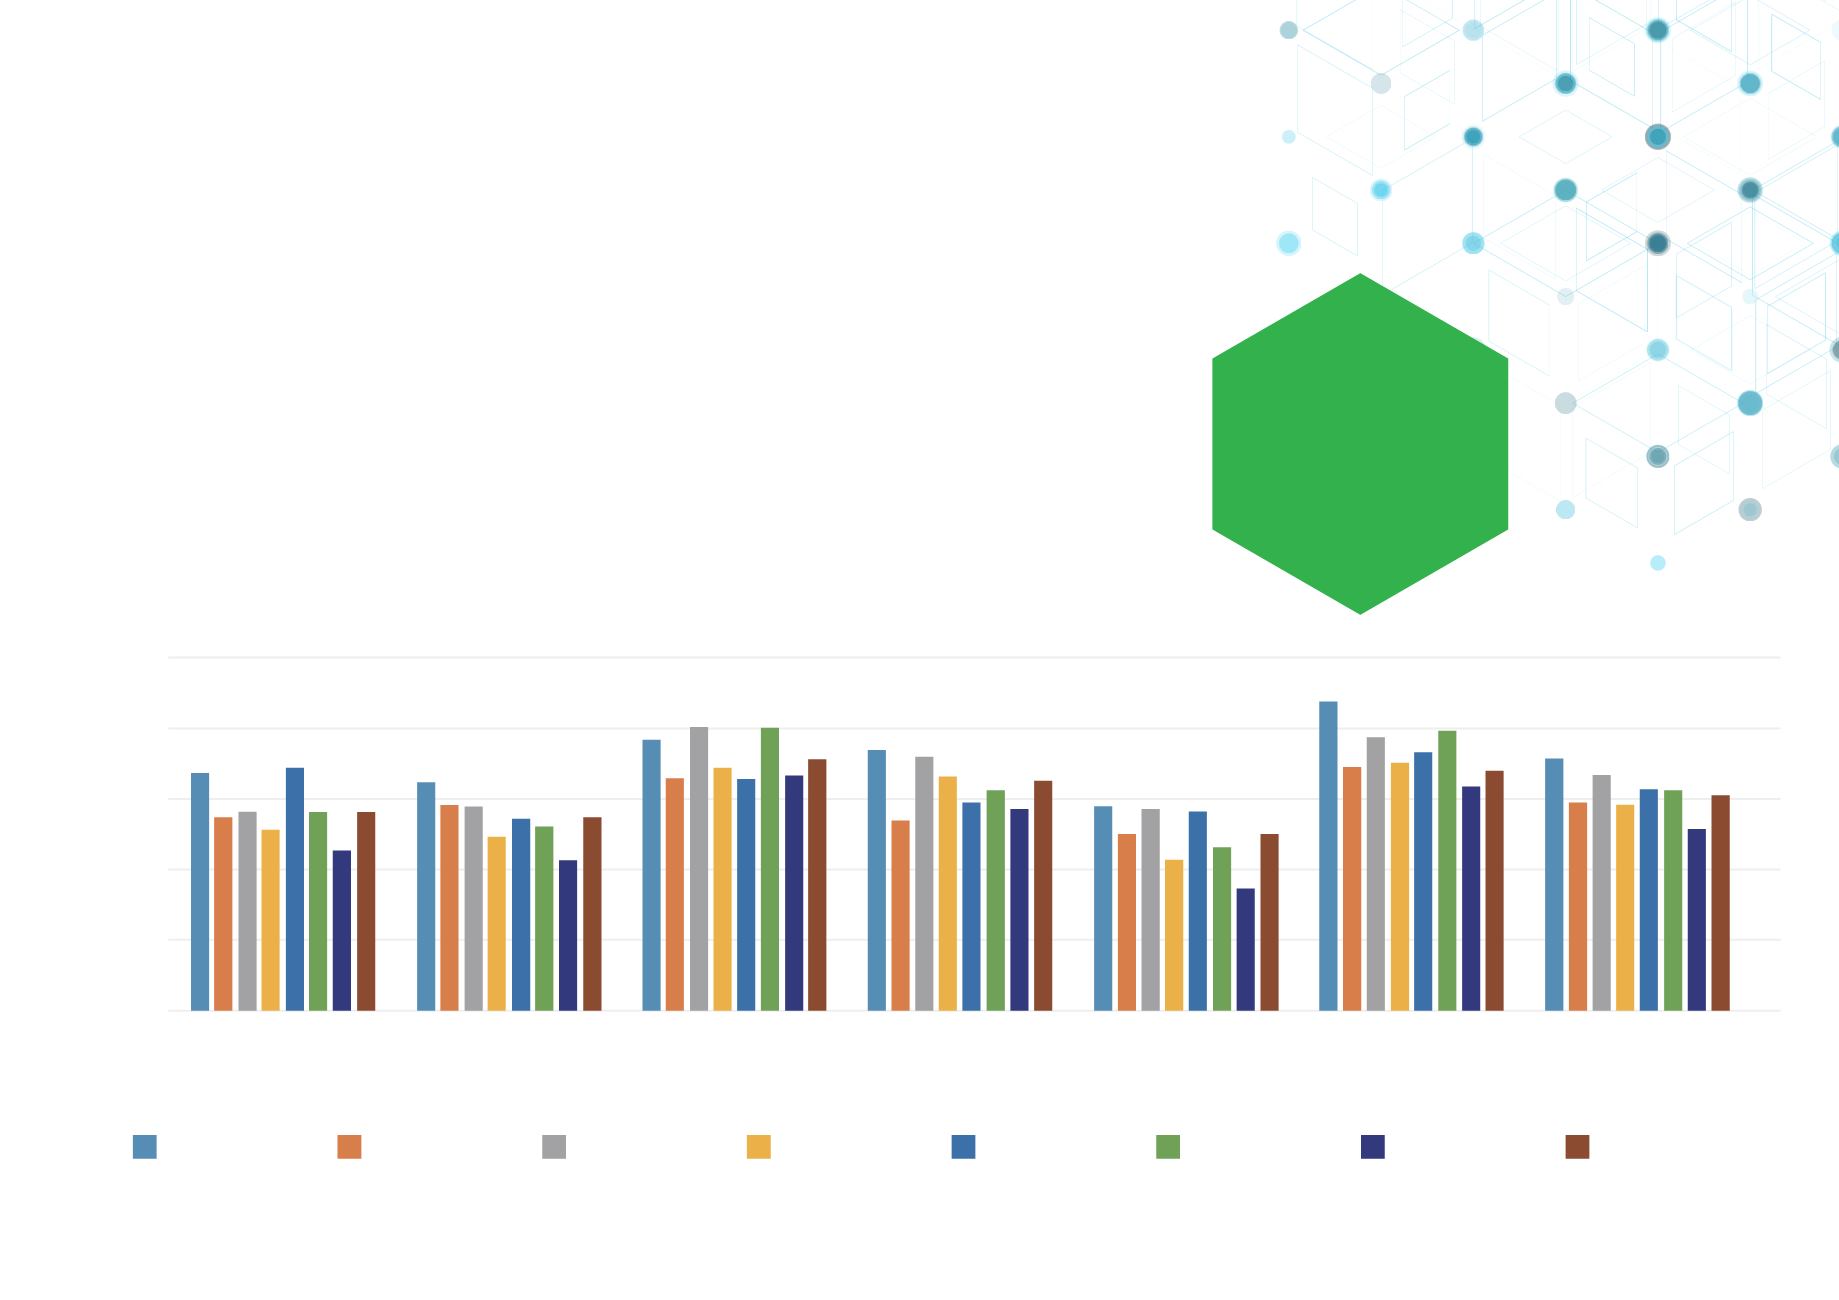
Scores of Satisfaction Survey over the Years
9
8.5
8
7
7.5
6.5
7.88
8.19
7.92
7.79
8.23
7.91
7.64
7.91
8.13
7.97 7.95
7.74
7.87
7.81
7.57
7.88
8.43
8.15
8.52
8.23
8.15
8.51
8.17
8.29
8.35
7.85
8.3
8.16
7.97
8.06
7.93
8.13
7.95
7.76
7.93
7.58
7.92
7.66
7.37
7.75
8.07
8.24
8.46
8.26
8.34
8.49
8.01
8.21
8.29
7.98
8.18
7.96
8.08 8.07
7.8
8.03
HSE
Quality
Responsiveness Communication
Schedule
Expertise
Average Score
The 1st half of 2012
The 2nd half of 2012
The 1st half of 2013
The 2nd half of 2013
The 1st half of 2014
The 2nd half of 2014
The 1st half of 2015
The 2nd half of 2015
In the first half of year 2015, CTCI has conducted customer
satisfaction surveys for 34 projects, and had received 30 valid
responses. On a scale of maximum 10 points, our clients have
given CTCI a score 7.80 points in terms of customer satisfaction.
Based on comments from our customers, our President is already
in charge of immediate project improvements. In the second half
of the year, we conducte customer satisfaction surveys for 38
projects, and 30 responses were valid. The average satisfaction
rate had been 8.03 points.
Besides comments from external customers, CTCI also
conducts internal customer satisfaction survey, and has compared
the results to the surveys from external customers and would both
serve as guidelines for quality enhancements. This would help us
to further understand the internal and external issues, advantages,
and disadvantages in each project. In the following year, CTCI will
ask each project to strive toward achieving a customer satisfaction
rate above 8 points.
Scores of Satisfaction
Survey over the Years


